ADF performance depends on server processing power. Sometimes ADF is blamed for poor performance, but in most of the cases real issue is related to poor server hardware, bad programming style or slow response from DB. Goal of this post is to show how fast ADF request could execute and give away couple of suggestions how to minimize ADF request time. This would apply to ADF application running on any environment, not only Docker. I'm using ADF Alta UI based list application with edit fragment.
Rule number one - enable response compression. This will allow to transfer less data and obviously response will execute faster - shorter content download time. See in the screenshot below - JS file is compressed to 87 KB from original 411 KB. Initial page load in ADF generates around 3 MB of content (if this is very first access and static content is not cached yet on client side). With compression initial load of 3 MB will be around 300 - 400 KB. Thats a big difference. In this example ADF page opens in 1.2 seconds (this is equal to client side JS applications, if static content is downloaded on first access):

You can enable content response compression in WebLogic console (will be applied for all deployed Web apps). Go to domain configuration, Web Applications section:

Select checkbox to enable GZIP compression and provide a list of content types to be compressed:

Thats it - content compression is set.
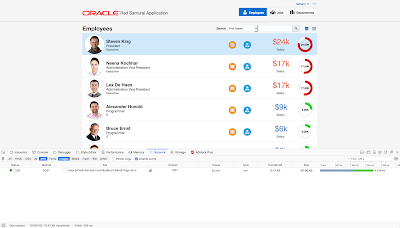
When I navigate to edit fragment - request is executed in 305 ms. Thanks to fast Docker engine (running on Digital Ocean - Oracle ADF on Docker Container) and content response compression: 3.44 KB transferred for 14.49 KB original content:

Let's try Save operation. I changed Hire Date attribute and then pressed Save button. This will trigger Commit operation in ADF, push data to ADF BC and then execute DML statement with commit in DB. All these steps are completed in 113 ms.

Don't believe anyone who says ADF is slow. As you can see, ADF request is very fast fundamentally - but of course it can become slow, if you add a lot of data fetch and processing logic on top (blame yourself). Client side JS application would not run faster, if it would call backend REST service to save data. The only advantage of JS client side application in this case would be that it executes backend REST call asynchronously, while ADF calls requests in synchronous manner. However, it all depends - sometimes asynchronous calls are not suitable for business logic either.
How come ADF BC call to DB completes so fast? For that we need to check Data Source Connection Delay Time on WLS. In Docker (Digital Ocean) environment it is ridiculously short (thats very good): 66 ms. Check same on your server (go to Data Source monitoring in WLS console), longer delay time means slower response from DB and slower ADF performance:

Navigation back to the list runs in 356 ms, with 197.96 KB of content compressed to 10.47 KB. This is very fast, 350 ms response time is something that user would not notice (almost equal to processing on client side):
To optimize ADF performance, make sure you are using ChangeEventPolicy = NONE for iterators in Page Definitions:

Rule number one - enable response compression. This will allow to transfer less data and obviously response will execute faster - shorter content download time. See in the screenshot below - JS file is compressed to 87 KB from original 411 KB. Initial page load in ADF generates around 3 MB of content (if this is very first access and static content is not cached yet on client side). With compression initial load of 3 MB will be around 300 - 400 KB. Thats a big difference. In this example ADF page opens in 1.2 seconds (this is equal to client side JS applications, if static content is downloaded on first access):

You can enable content response compression in WebLogic console (will be applied for all deployed Web apps). Go to domain configuration, Web Applications section:

Select checkbox to enable GZIP compression and provide a list of content types to be compressed:

Thats it - content compression is set.
When I navigate to edit fragment - request is executed in 305 ms. Thanks to fast Docker engine (running on Digital Ocean - Oracle ADF on Docker Container) and content response compression: 3.44 KB transferred for 14.49 KB original content:

Let's try Save operation. I changed Hire Date attribute and then pressed Save button. This will trigger Commit operation in ADF, push data to ADF BC and then execute DML statement with commit in DB. All these steps are completed in 113 ms.

Don't believe anyone who says ADF is slow. As you can see, ADF request is very fast fundamentally - but of course it can become slow, if you add a lot of data fetch and processing logic on top (blame yourself). Client side JS application would not run faster, if it would call backend REST service to save data. The only advantage of JS client side application in this case would be that it executes backend REST call asynchronously, while ADF calls requests in synchronous manner. However, it all depends - sometimes asynchronous calls are not suitable for business logic either.
How come ADF BC call to DB completes so fast? For that we need to check Data Source Connection Delay Time on WLS. In Docker (Digital Ocean) environment it is ridiculously short (thats very good): 66 ms. Check same on your server (go to Data Source monitoring in WLS console), longer delay time means slower response from DB and slower ADF performance:

Navigation back to the list runs in 356 ms, with 197.96 KB of content compressed to 10.47 KB. This is very fast, 350 ms response time is something that user would not notice (almost equal to processing on client side):

To optimize ADF performance, make sure you are using ChangeEventPolicy = NONE for iterators in Page Definitions:

19 comments:
Excellent post Andrejus, will revisit our applications deployed and implement your suggestions on weblogic and will gather the statistics on performance improvements. Thanks again.
Regards,
Karthik Nag S
Thanks Andrejus for your excellent post.
For changing the value of changeEventPolicy=None instead of ppr I think it will effect on page responsivity, cause the ppr will forece the framework to update just the changed value(s) in iterator. What is the wrong on that?
Appreciated!!
Yours Sincerely,
Yazan Mohammad
PPR is bad for performance, because of three reasons:
1. It may generate extra HTTP request to refresh values
2. Response size is almost double, because a lot of extra HTML content is included to support PPR. This is killer for complex forms
3. Often PPR will force reload of ADF table, even when user navigates from one column to another, without changing values. Refresh is executed too often
As golden rule - we always set ChangeEventPolicy=NONE. PPR can be used only in special cases, where you cant set Partial dependency in advance. In general I would recommend to use af:target tag to force refresh, when needed - http://andrejusb.blogspot.lt/2013/08/adf-12c-target-tag-to-enhance-ppr.html
Andrejus
Have applied this to my domain and restarted the servers, unfortunately I see no improvement?
It all depends on hardware (Digital Ocean runs fast in our case) and how app was developed too.
Also double check if compression is applied, you can do it from developer tools in the browser.
Regards,
Andrejus
I have already checked this with IE developer tools before and after applying the change to WebLogic. The size of the loaded packages is the same. And it is the same as the original file size, as checked against some Javasript libraries. I'm on physically hardware in the intranet, but it seems that nothing is compressed. I have absolutely the same settings as in your blog now.
Not sure, in our multiple environment it works - WLS compression setting should be working. We are using WLS 12.2.1.3. Which is your version.
Check if gzip is present in response header. If not - means compression wasnt applied.
Regards,
Andrejus
I see
Accept-Encoding gzip, deflate
in the request header but nothing similar in request header.
We use version 12.2.1.2.
If no gzip in response header - means not applied.
There is minimum size 2048 KB set by default, files smaller size not compressed. May be its your case.
Regards,
Andrejus
Is it possible that following in the web.xml overwrites this?
org.apache.myfaces.trinidad.DISABLE_CONTENT_COMPRESSION
true
In development this is set to true for automatic selenium testing.
We have deployment plans, which change this to false for the real application deployment, but I have to double check if this does not work anymore for some reason.
Could be. You should test on small sample app to be 100% sure.
Regards,
Andrejus
Have reduced to minimum size of 100. Doesn't find any documentation, if B, KB, MB is meant here.
By the way - you have set minimum size to 2048 according to your screenshot. Anyway you say that content is compressed from 197.96 KB to 10.47 KB, so whether you have another setting than in the screenshot or the unit of measure is not KB.
But is does not work with a sample app without DISABLE_CONTENT_COMPRESSION in web.xml in local windows environment too.
So next week I will test with 12.2.1.3.
It was mistype in comment about KB. Based on 2048 setting, everything larger than 2048 bytes should be compressed.
I checked on 12.2.1.1 - compression is applied, but it is not applied when testing from IE browser (seems like your case). However, may be it is still applied, by IE doesnt show correct info.
Try with Chrome or Firefox.
Regards,
Andrejus
I have tested this successfully with 12.2.1.2 and Firefox, there is transferred column which show the difference to the size of the downloaded object. Additional I can see Contenct-Encoding: gzip in the response header.
The loading time shows not so dramatic differences as in your example, but there is one. I believe this is because we are in the intranet here.
Chrome Dev Tools are administrative disabled here.
In IE I there is no transferred column. But in both scenario's it does not show difference in loading and I cannot see Content-Encoding: gzip in the response header, so I believe that gzip compression will not work there. Our test battery doesn't show any improvement in execution time after change the settings.
I will open a sr for this at oracle.
If there is no gzip in response header, means compression wasnt applied. Yes, please open SR for IE.
Compression would show improvement on external network, on local network it doesnt matter too much - if network speed is fast anyway. In my example, I run app on Docker cloud and accessing it through public network.
Regards,
Andrejus
I think in previous version (eg Jdev11.2.4), http response is by default compressed, it seems dropped in 12c release and it was added back in latest 12c.
I dont think so, I think it was never by default compressed.
Regards,
Andrejus
Thanks for your post!!
I just like to share how we did achieved the compression and caching from Oracle Http Server / Apache deflate modules rather than on weblogic
LoadModule include_module "${PRODUCT_HOME}/modules/mod_deflate.so
....
#Caching of static files
ExpiresActive On
ExpiresByType image/gif "access plus 1 years"
ExpiresByType text/javascript "access plus 1 years "
.....
Regards,
Mayil
Good point Mayil. We can enable response compression on HTTP server in front of WLS. Torsten, you may consider this too.
Regards,
Andrejus
Post a Comment